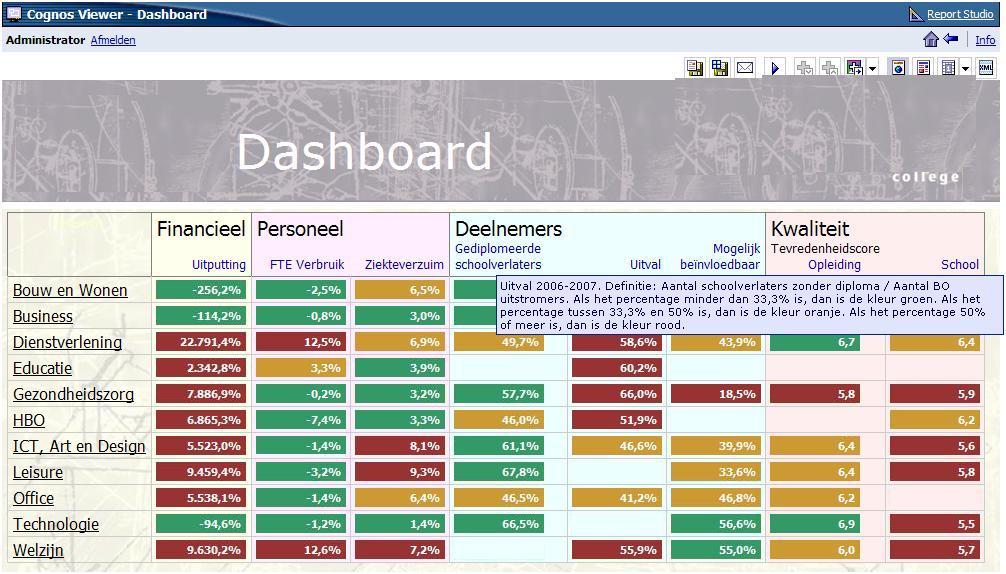
It is used by the management of an educational center to easily and quickly view the current status of the key performance indicators of the organization. Of course, the numbers used in this picture are entirely fictitious (albeit not unrealistic!).
Feature highlights:
- The framework consists of multiple dimensionally modeled star schema's, each with it's own regular dimensions. Common regular dimensions (i.e. the organization dimension) are related through relationships from each fact query subject to one central organization query subject.
- The report makes use of multiple master-detail relationships. The organization dimension is used in the master query, and is linked to each organization level query item in the detail query. In the report example, most columns displayed are from separate detail lists. So the master query delivers the drill down capability through the organization, and the detail queries deliver the indicator information.
- Coloring of the indicators is done by using conditional style variables.
- When the mouse cursor is on one of the blue indicator names, a blue popup tooltip window appears containing both dynamic and static information. This is built by creating a report expression in an HTML item. The HTML item is an anchor tag <a> using the onmouseover attribute and some JavaScript code. Many thanks to Walter Zorn for sharing this piece of JavaScript! The report expression looks like this:
'<a onmouseover="Tip(''Uitval ' + [Detail Deelnemers BO uitstroom].[Schooljaar o.b.v. Specfieke peildatum] + '. Definitie: Aantal schoolverlaters zonder diploma / Aantal BO uitstromers. Als het percentage minder dan 33,3% is, dan is de kleur groen. Als het percentage tussen 33,3% en 50% is, dan is de kleur oranje. Als het percentage 50% of meer is, dan is de kleur rood.'')">Uitval</a>'
9 comments:
Heey a blog from Marc again!
That "mouseover" feature is nice. Is it also possible to put a picture in the tooltip window?
Hi Mike,
Oh yes it certainly is possible to show a picture in the tooltip window.
Just take a look at Walter Zorn's http://www.walterzorn.com/tooltip/tooltip_e.htm page and hold your mouse over the images link...cool huh?
Cheers,
Marc
Ah, that's nice. It's done with an img-tag.
Gr.
Mike
Marc -
would it be possible to change the color of the dropdown text of a value prompt based on a condition?
I reckon it would be possible indeed to change the color of the dropdown text of a value prompt based on a condition.
But it would be a tough job to do!
I think the solution would be to code some JavaScript in the report, just like I've also written about in this posting. In addition to this, the conditions specified in the report also have to be retrieved and applied to determine the color of the drop down text items.
As my knowledge of JavaScript is rather limited, I would not specifically know how to do this, but perhaps this is already done and published somewhere on the Internet...
Thats was a quick response marc. Atleast do we know what are all the objects and properties/methods available for the formwarprequest?
I am talking about ._oLstChoicesXXX etc and its properties...
Well, you could consult the Software Development Kit developer guide containing a list of all items Cognos 8 objects, methods and properties. But this might not help much using JavaScript.
The Cognos Support Knowledge Base however does contain some useful documents regarding using JavaScript. Try searching for formWarpRequest for example.
Marc -
I searched the KB articles. Most of them are discussing about olstchoices and not mentioning about other methods/properties.
However I did find the solution my issue. How to change to font color ?
document.formWarpRequest._oLstChoicesXXX0].style.color = 'RED';
But I am not sure how can I make this dynamic based on field staus. Like...
If myfield_status = active then
font color is red
else
font color is blue
end if
some thing like this. I don't know how can I bring report variable into HTML Item.
In this post an example is given for an HTML item containing a report expression. In the expression a query item is referred to, e.g. [Detail Deelnemers BO uitstroom].[Schooljaar o.b.v. Specfieke peildatum].
The problem in your case is that the entire HTML item will be conditionally styled if you do it the way it is supposed use in Report Studio. And you just want to refer to it in the JavaScript code.
Hmmmmmm...
Post a Comment