Actually, the reporting solution for this customer consisted of several dashboard reports, one for each type of manager. Each dashboard shows up to 6 charts (one per KPI). Clicking on a chart runs a KPI report like you've seen in the prevous post, containing the button list of measures as well as the "Go to Analysis Report" link. Clicking on this link runs a commonly defined Analysis Report.
The Analysis Report:
- is a generic Report Studio type report called from every specific KPI-report
- receives the specific KPI value as a parameter value
- was developed to deliver basic analysis capabilities to the manager, licensed for not more than the Consumer role
- displayes a crosstab specified by the user
- features limited row and column selection options, including filtering
- offers only the dimensions and measures relevant to the passed KPI, thus being "Contextual"
This report enables the manager (a Cognos Consumer user) to perform some analysis on his business performance without having to use Analysis Studio. This not only reduces the TCO (because no Business Analyst license is needed), but it also relieves the burden of having to learn another user interface with more functionality than strictly needed.
In this project, 30 KPI's were developed. All of these were included in the Measure Dimension Matrix. Each KPI related to one group of measures (resulting in about 120 measures including regular and calculated measures). However, not each measure group relates to a dimension. So it was a rather mixed matrix with moderate scarcity (i.e. empty cells). (Besides that, not all related measures were bound to the same lowest level of any dimension. This is however neatly resolved by scoping the dimension levels in Cognos Transformer.)
The Analysis Report looks like this. It's an example of KPI01 having 6 dimensions related to it. Mind that the total Multi Dimensional Model (MDM) consists of 25 dimensions and 30 KPI's. Using render variables each KPI-parameter is evaluated and the relevant prompt is shown or hidden. Note also that so many dimensions and measures in the model will make this a heavy report, as it will contain a lot of code!
 |
So the report opens up with the prompt page offering prompts for selection of:
- a primary and secondary dimension to be displayed in the outer and inner rows of the crosstab (only the dimensions related to the KPI!)
- a measure within the group of measures the specific KPI represents
- a period of time to be displayed in the columns of the crosstab
- additional filtering (optional) of items of the related dimensions
When the user finishes the prompt pages, the report runs resulting in a crosstab. The prompts are shown in the top half of the report page itself for immediate adaption by the user (Auto-submit).
 |
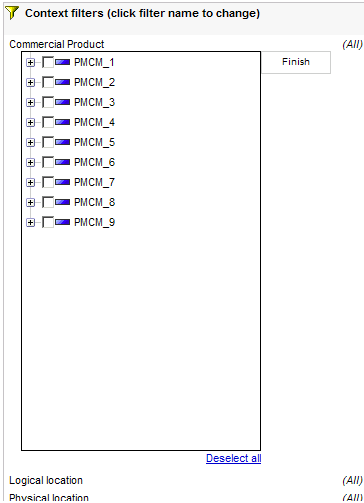
Toggling of Tree Prompts
Aside from the contextual features of this report, a technique has been applied to toggle display of the optional prompts.
The optional filter prompts in both the prompt page and the report page are Tree Prompt objects. They appear as soon as the user clicks a dimension. Here, some HTML Items containing JavaScript code, <a> and <div> tags are used to toggle display of the prompts.
 |
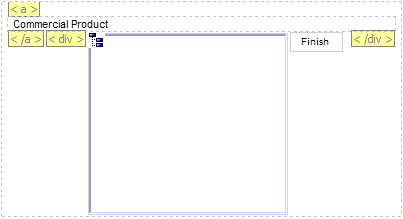
These items are:
1. at the start of the page, an HTML Item containing the code:
<script language="javascript" type="text/javascript">function toggleDiv(divId) {var theDiv = document.getElementById(divId);if (theDiv != null) {var divStyle = theDiv.style;divStyle.display = (divStyle.display == "none" ? "block" : "none");}}</script>
2. before the dimension filter link, an HTML Item containing the code:
<a class="togglePrompt" href="javascript:toggleDiv('prompt_Product');">
3. after the link and before the tree prompt, two HTML Items containing the code:
</a><div id="prompt_Product" style="display:none;">
4. after the tree prompt, an HTML Item containing the code:
</div>
It looks like this for each dimension filter:
14 comments:
hi,nice work.....
Now i am trying to learn cognos.It is far more difficult from oracle Bi.
I would like to ask you a question.I try to do this more than 2 days.
How can we choose a period of time from 2 calendars if our pachage is a cognos cube??
tnks in advance!
@eejimkos: thanks for your compliment!
Re. the 2 calendar question: just build 2 prompts, one per calendar, assign them to one parameter each (e.g. 'prompt_cal_1' and 'prompt_cal_2') and then combine them in the query filter. For example: [Date] in (?prompt_cal_1?) or [Date] in (?prompt_cal_2?)
Two remarks in general:
- if you're new to Cognos 8 BI, I'd recommend taking a dimensional authoring course;
- as far as developing reports concerns, it's not so difficult to mess up your report definitions by addinf a lot of different functionalities at once. It's better to insert and test one functionality at a time (incremental development) and save each enhancement in a new version.
Marc,
tnks for your quick reply.
////////////
Re. the 2 calendar question: just build 2 prompts, one per calendar, assign them to one parameter each (e.g. 'prompt_cal_1' and 'prompt_cal_2') and then combine them in the query filter. For example: [Date] in (?prompt_cal_1?) or [Date] in (?prompt_cal_2?)
///////
This can be done only if we use dimensional model and not a cube.
I find and this link but it does not have for days...
///
http://www-01.ibm.com/support/docview.wss?uid=swg21341485
///
Thanks for the tip on toggling, it's just what I've been after.
Any idea on how to limit the levels shown in a tree prompt? Eg My tree consists of 4 levels but I only want to display levels 1-3. I can use 'descendants' to get the last level (4th) but what I need is the ascendants (no such function)... any ideas?
Hi Ruby,
It's not simple to limit the number of levels in a tree prompt. Al least, I cannot find an easy way to do that. In Report Studio, you could look at menu Data > Drill Behavior, but that only applies to drilling in the report's result data, not in prompt data.
If this limitation is really needed, then I would suggest to create a second dimension (in Framework Manager) or drill down path (in Transformer) having limited levels, and using this in the report.
But on first hand I would ask the user why there's a need for limitation at all. Anything that makes the application more complex must have a sound argument for doing it.
Very few people share information for the sake of sharing alone.Great effort here!!
I am blown away by the level of in depth insight on your blog, Marc. Readers of your site, including me, can learn so much by just spending 10 minutes here.
I have my own blog for Cognos, specifically relating to training. If you're interested in visiting, the blog can be found here:
http://cognos.integrotraining.com
Thank you very much for your good information.
As I noted in the ... given information is very usefull to every student who ever want to learn about
the best Cognos Online Training
Hello Marc,
Thank you for sharing this Contextual Analysis Report. I'm trying to create something similar to this. I'm unable to view the images above. Can I have a look at the images by any chance? It will help a lot.
Thanks.
Images have been restored now, for all posts on this blog. Excuse me for having neglected it for a while.
Thank you Marc for this blog. Very useful!
The information that you have provided in your post. It is really helpful. I had never though about that but some of the ideas here i really like.
Good Post,The information that you have provided in your post. It is really helpful. I had never though about that but some of the ideas here i really like.
Post a Comment