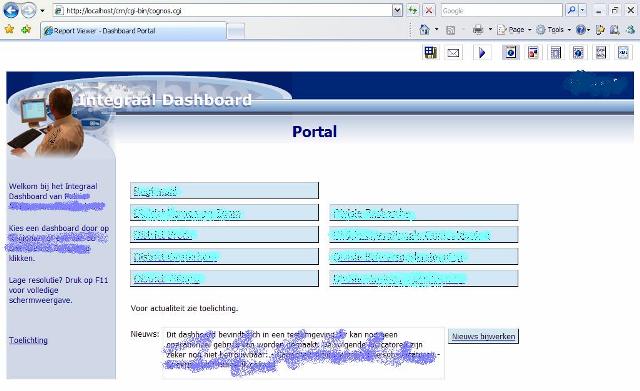
In the large white box (blue brushed) you see the latest news, which the administrator can update using the button next to it! Actually, this update button calls another ReportNet report, starting with a prompt that is passed to a stored procedure in the database. This stored procedure performs the record update.
The large buttons act as hyperlinks. The button text is derived from an item in a query retrieving organizational unit names.
Each button drills through to a common ReportNet report containing high level KPI's colored red, orange or green, something like this:
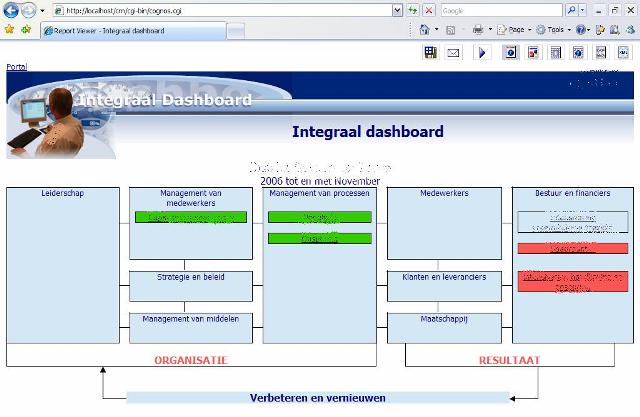
Each high level KPI is not only an indicator, but also a drill through to a report showing the low level indicators by color, including its achieved values by month and the forecast values:
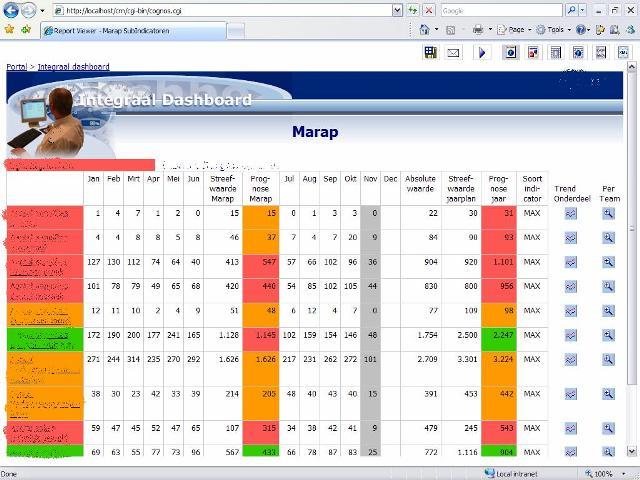
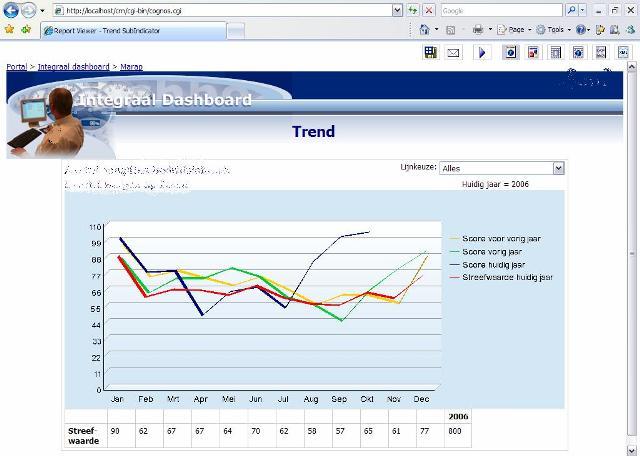
This 'Marap', or Monthly Report, contains small buttons for drilling through to reports for organizational Monthly Report breakdown and graphs:
Other characteristics of this hierarchical approach:
- Users are provided with a URL (which has also been published to the client' s intranet) eliminating the Cognos Connection header, resulting a clean interface;
- The user's path through the report structure (in Dutch it is called 'kruimelpad') is displayed at the top of every report page and contains links back to previously opened reports.
I plan to reveal the technical details of each of these characteristics in upcoming blog posts. But for now, it's only to show you an approach to creating easy-to-use dashboard applications.
3 comments:
Hi Marc, I think this is a nice example of how to implement scorecarding technology to measure the INK model. Good Blog !
Hoi Marc,
mooie en intuitieve user-interface heb je ontworpen en gebouwd.
Goede blog!
This is great info to know.
Post a Comment